ZIP & Market Reports
Median price trends, how fast things are selling, supply against demand and opportunity scoring, all at ZIP level, because a metro average can hide everything that matters on one side of town.
Who It's Built For
Commercial desks, independent investors, and owners on either side of a sale all work from the same parcel records and the same owner contacts. The only thing that changes between them is how much of it they need in a month, which is what the plans are actually measuring.
196M+
Parcels, Scored & Ranked
National
Market & Overlay Coverage
~$0
Per Outreach Send
Commercial · Custom Pricing
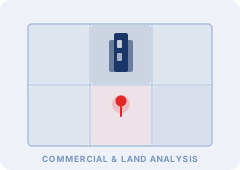
Each desk watches a different clock. Capital Markets watches loan maturities and distress, so you can see which owners will have to refinance or sell and roughly when. Leasing & Landlord watches tenants expanding or relocating, so you can fill a building from companies that are already looking instead of calling people who are not. Tenant Rep watches lease expirations and headcount changes, so you reach a corporate occupier while they are still deciding. The underlying records are identical in all three.
All three are quoted per desk rather than off a price list, and all three include skip-trace, polygon campaigns, the LOI generator, Deal Room and Market Radar.
Residential · From $29/mo

Explorer is $29 a month and covers the market itself: listings, mortgage rates, pending sales and price trends, a map with visible addresses and home values, demographics, and flood and fire risk. You can also list your own properties on the marketplace, as many as you want.
Investor is $249 a month and adds the things that change a decision: key rates, the CMBS maturity wall, REIT performance and where people are moving. It also raises the monthly allowance to 3 reports, 50 credits and 20 leads, which is roughly what running a real pipeline takes. Both plans are month to month.
Owners Selling · First Listing Free
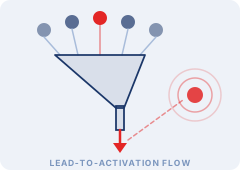
You can put a home, a piece of land or a commercial building on the same marketplace the rest of the platform feeds, in front of buyers who turn up already knowing what the block is worth. The first listing is free, and listings are unlimited on any plan.
Buyers contact you directly. We do not charge per lead and we do not sell the same enquiry to four other people.
Owners Buying · No Subscription Needed
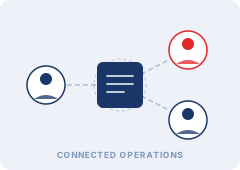
Homes, land and commercial sit in one marketplace, listed by the people who own them. Before you make an offer you can pull the ownership history, the tax record, a lien search, comparable sales, an equity estimate and the deed chain for that exact parcel, which is usually a good deal more than the listing itself mentions.
None of that needs a subscription. Reports are sold individually, and if you buy a pack the credits can be used by whoever is helping you look.
Demographics, infrastructure, market conditions, development pipeline, risk signals, and economic indicators, layered on a live intelligence map that surfaces opportunity clusters and site constraints no static dataset can replicate. The answer is on the map before the question is finished being asked.
Lead intelligence, verified owner contacts, and multi-channel outreach automation run in the same workflow. What used to require three separate tools and a data export now happens in one environment, with the market context intact from the first signal to the first signed agreement.
Multi-user roles, shared report collections, watchlists, and campaign management, the collaboration layer that scales from a solo operator to a 50-person institutional team without rebuilding the workflow at each stage of growth.
Adjust the inputs below to model the platform's potential impact for your team. Numbers are directional, actual results depend on execution, market conditions, and deal economics.
Estimated Monthly Value Created
$0
Estimated Monthly Net Impact
$0
Estimated Annual Net Impact
$0
Estimated Annual Value Created
$0
ROI on Platform Cost
0%
These numbers look relevant to your operation. Talk to us about your specific configuration →
Estimates are directional only and depend on team execution, market conditions, data quality, and deal economics.
Median price trends, how fast things are selling, supply against demand and opportunity scoring, all at ZIP level, because a metro average can hide everything that matters on one side of town.
Ownership history, equity position, lien detail, comparable sales, distress signals, and neighborhood risk: assembled before the offer, formatted for credit committee review.
Zoning, infrastructure, ownership, development comparables, and environmental risk: the intelligence that kills bad land deals before the entitlement attorney starts billing.
Hold against exit, how the deal behaves if rates move, and what a bad case looks like, worked out while you are still deciding whether to buy.
Comparable transactions, trade area demand, tenant market signals, and development pipeline: commercial due diligence that moves at deal speed without a full-time research analyst behind every acquisition.
Current occupancy, employer density, comparable transactions and what the building could become, measured against how the office market is trading today.